Inside the Insighthread Dashboard: A Tour of the Home Feed
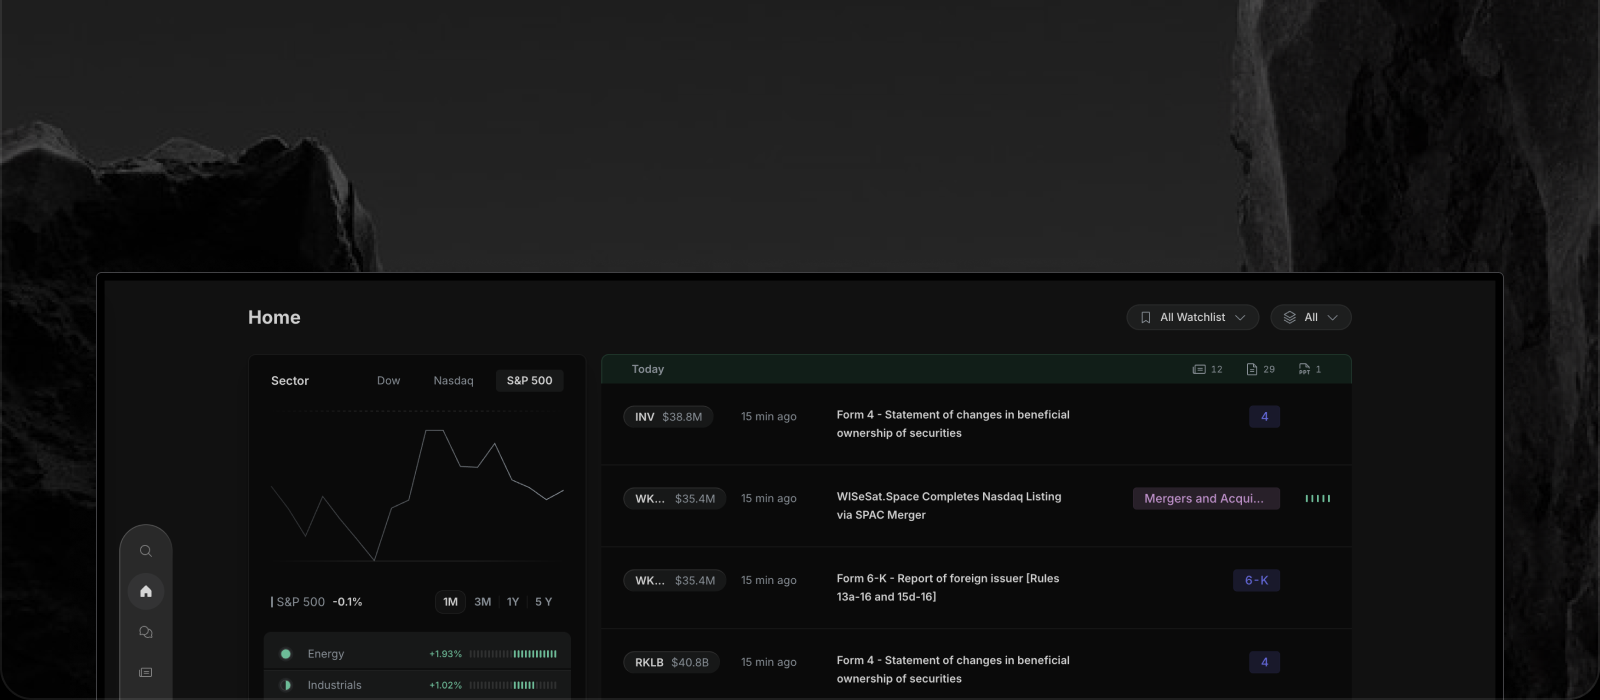

Insighthread is a complete app for investors, with a dashboard you can use every day.
You do not need to be a developer or to integrate anything.
This tour walks through the Home page and shows what you see when you open it.
The Insighthread Home feed: one stream for your watchlists
The Home page is a single, unified activity feed.
It brings together news, SEC filings, earnings call transcripts and investor presentations for the stocks on your watchlists.
Items are grouped by date, from Today and Yesterday back through earlier weeks.
Each date header shows small counts for how many news items, filings, transcripts and presentations that period contains, so you always know what else is there.
Choose your scope: all watchlists, one, or several
By default, the feed covers all of your watchlists.
A dropdown at the top lets you narrow it to a single watchlist, to several at once, or to everything except the ones you exclude.
These are the same watchlists you manage on the Watchlist page.
Filter the Home feed by type: news, filings, transcripts and presentations
A second dropdown sets the content type: All, News, SEC Filings, Transcripts or Presentations.
Pick one, and the feed shows only that kind of item.
The panel on the left changes with it.
With News selected, it becomes a list of event categories, such as Corporate Earnings, Dividends, C-Level Change and FDA Approval/Rejections.
With SEC Filings selected, it becomes a list of filing types, such as 8-K, Form 4 and 10-K.
Tick a box, and the feed narrows to just that category or form.
What each row in the Insighthread feed tells you
Each row is designed to be read at a glance.
A news row shows the ticker with its market cap, the time, a headline, a category badge and a five-bar impact signal.
A filing row shows a coloured form-type badge, so you can see whether it is a Form 4, a 6-K or a 13G before you open it.
Transcript rows are marked as Earnings Calls, and presentation rows are marked as Presentations.
Drill into any item without losing your place
Click a news headline, and the full article opens as an overlay with a Sources section that cites the SEC filing it was generated from.
Click a filing, and the actual filed document opens in a viewer with zoom controls and page thumbnails.
Click a transcript, and you can read the full earnings call speaker by speaker, with Copy and Ask AI buttons at the top.
Click any ticker, and that company's profile opens on top of where you are.
Close the overlay, and you are back exactly where you started.
Ask the AI analyst about whatever you have open
Every one of those views has a Chat button.
When you open it, the item you are looking at is attached automatically, so you do not need to retype the ticker or the document name.
The suggested questions change with the item.
A transcript offers prompts such as Management Tone and Risks and Concerns, and a news article offers Market Impact and What to Watch.
You can read more about it on the AI chat page.
A dashboard built for scanning first, reading second
The whole Home feed follows one idea: show the signal first and let you go deeper only when you choose to.
That is why the feed is a single stream, why every row carries its badges, and why detail opens as an overlay rather than a new page.
To see it with your own stocks, try Insighthread free for 7 days, no credit card needed.